Determine data latency between Publisher and Subscriber in SQL Server Transactional Replication
Ref:
http://www.mssqltips.com/sqlservertip/2590/determine-data-latency-between-publisher-and-subscriber-in-sql-server-transactional-replication/
To find out what still needs to be replicated, we could use both
Replication Monitor as well as T-SQL commands to find out how what needs
to be replicated to the subscriber database. Both options assume
transactional replication is already configured in your environment.
Option 1: Using Replication Monitor
In SQL Server Management Studio (SSMS), navigate to
Replication and right click and select
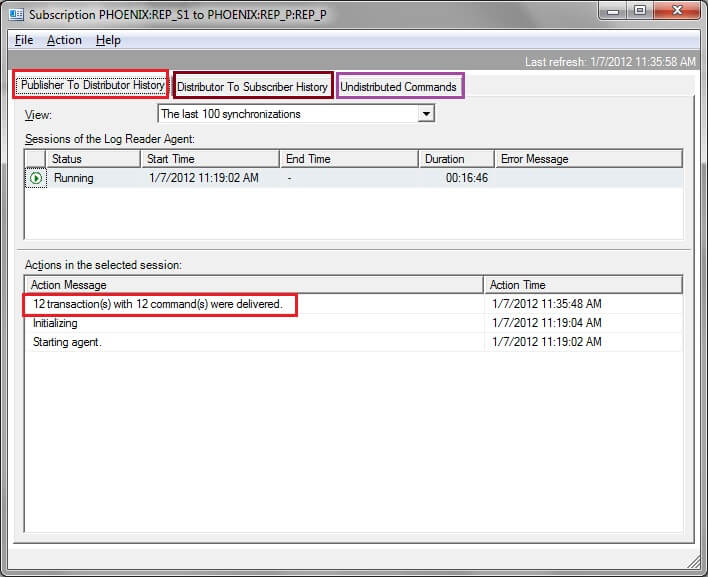
'Launch Replication Monitor'. Go to your listed server and expand it. Click on your publication and on the right side pane under the
'All Subscriptions' tab, go to your subscription and double click on it. Once done, you would see this window.
From this window, you could see the details of the activities that
are occurring between the 'publisher-distributor' and
'distributor-subscriber' combinations. Click on the respective tabs to
check the status of replication. If there are any replication commands
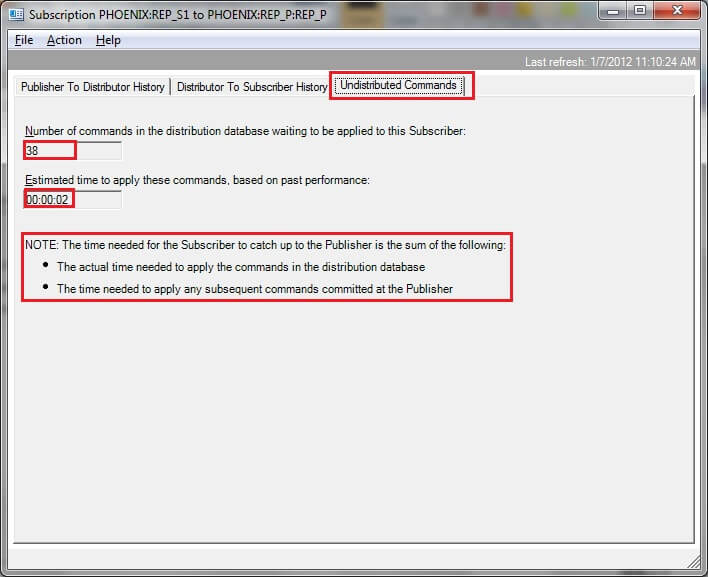
that remain to be applied at the subscriber from the distribution
database you would see the details in the 'Undistributed commands'. From
this tab, you would get an idea of estimated time remaining to apply
commands at the subscriber. Below is a sample screenshot.
Replication Monitor gives you this simple interface to identify any
issues you may face with your replication configuration. For more
details related to replication latency, we could use some replication
commands as shown below.
Option 2: Using Replication commands
Run this on publisher database
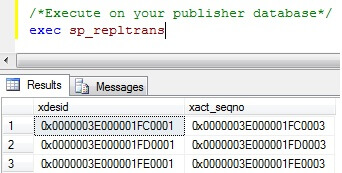
To check if replication is fine, we could run
sp_repltrans
on the publisher database. This displays the undistributed commands
present in the publisher database. If your log reader agent is scheduled
to run continuously and if this command returns no rows, replication is
fine on the publisher side. However, if your log reader agent is
scheduled to run at intervals and there are changes that need to be sent
to the distribution database, you would see rows returned when you
execute (during the interval) this procedure which shows the LSNs of the
transactions. See sample screenshot below.
On a busy server, if the log reader agent is running continuously, the rows that are returned after executing
sp_repltrans
would be constantly changing based on the load. By using this
procedure, you wouldn't get the exact command that is pending but you
would get an idea on the progress that is happening in your replication
environment.
Run this on distribution database
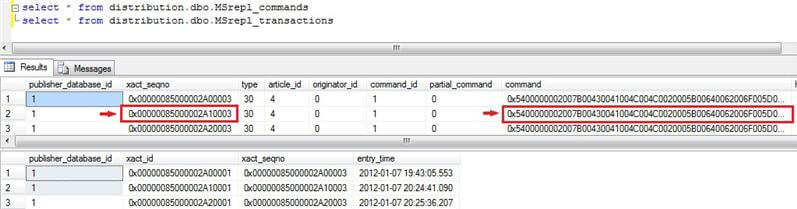
The distribution database contains the system tables -
MSrepl_commands and
MSrepl_transactions which contain details of the replicated commands. Here is a sample output of a select query on these system tables.
select * from distribution.dbo.MSrepl_commands
select * from distribution.dbo.MSrepl_transactions
From the screenshot, we could see that the command column is of
varbinary datatype and is non-readable. Hence, we could execute the
sp_browsereplcmds
system procedure in the distribution database with the relevant
parameters and retrieve the data of the replicated commands in a user
friendly manner.
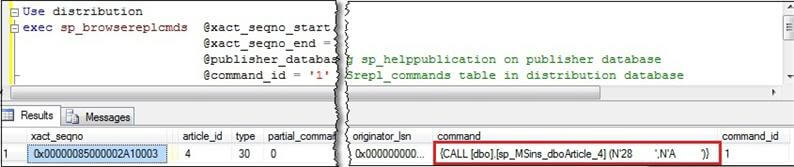
In the above example, if we need to find out the actual command
corresponding to xact_seqno = '0x00000085000002A10003' and command_id =
1, we could execute
sp_browsereplcmds with these parameters. See screenshot and sample script below.
Use distribution
exec sp_browsereplcmds  @xact_seqno_start = '0x00000085000002A10003',
                        @xact_seqno_end =   '0x00000085000002A10003',
                        @publisher_database_id = '1', -- run sp_helppublication on publisher database
                        @command_id = '1' -- command_id in MSrepl_commands table distribution database
Here, we could see the actual command that was executed which was an
insert statement. It is recommended to execute this procedure with the
appropriate parameters otherwise it could result in generation of a huge
number of rows as output.
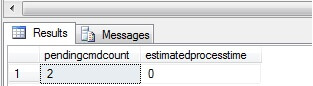
In option 1, using replication monitor, we saw how to view the
'undistributed commands'. The same data could be obtained by executing
sp_replmonitorsubscriptionpendingcmds in the distribution database. Use sample script below.
sp_replmonitorsubscriptionpendingcmds
 @publisher ='Enter publisher server name',
 @publisher_db = 'Enter publisher database name',
 @publication ='Enter name of publication',
 @subscriber ='Enter subscriber server name',
 @subscriber_db ='Enter subscriber database name',
 @subscription_type ='0' --0 for push and 1 for pull
Below is a sample output.
Testing
In your test replication environment, you could stop the distribution
agent job and run a few insert commands in the publisher database. Once
done, execute this procedure
sp_replmonitorsubscriptionpendingcmds
in the distribution database to find out the details of the pending
commands to be applied on to the subscriber. Then proceed to query the
MSrepl_commands and
MSrepl_transactions system tables in the distribution database to determine the actual commands that are yet to be sent to the subscriber. Using
MSrepl_transactions system table you could get the time you had executed the insert statements in your publisher database. Then make use of the
sp_browsereplcmds
as shown above to find out the full text of commands by providing the
appropriate parameters. This would give an idea of the actual commands
that are yet to be replicated to the subscriber.
You can also use this script to query the distribution system tables.
select rc.publisher_database_id, rc.xact_seqno, rc.command, rt.entry_time
   from MSrepl_commands rc, MSrepl_transactions rt
    where rc.xact_seqno =  rt.xact_seqno
It should be noted that the data available in MSrepl_commands,
MSrepl_transactions, sp_browsereplcmds is purged periodically based on
the schedule of the distribution clean up job and the distribution
retention period.